


End-to-End Analytics Pipeline with Snowflake
Learn how to build an end-to-end analytics pipeline with Snowflake—from understanding and ingesting raw business data to transforming it into clean, curated datasets for trusted dashboards and real-time decision-making.
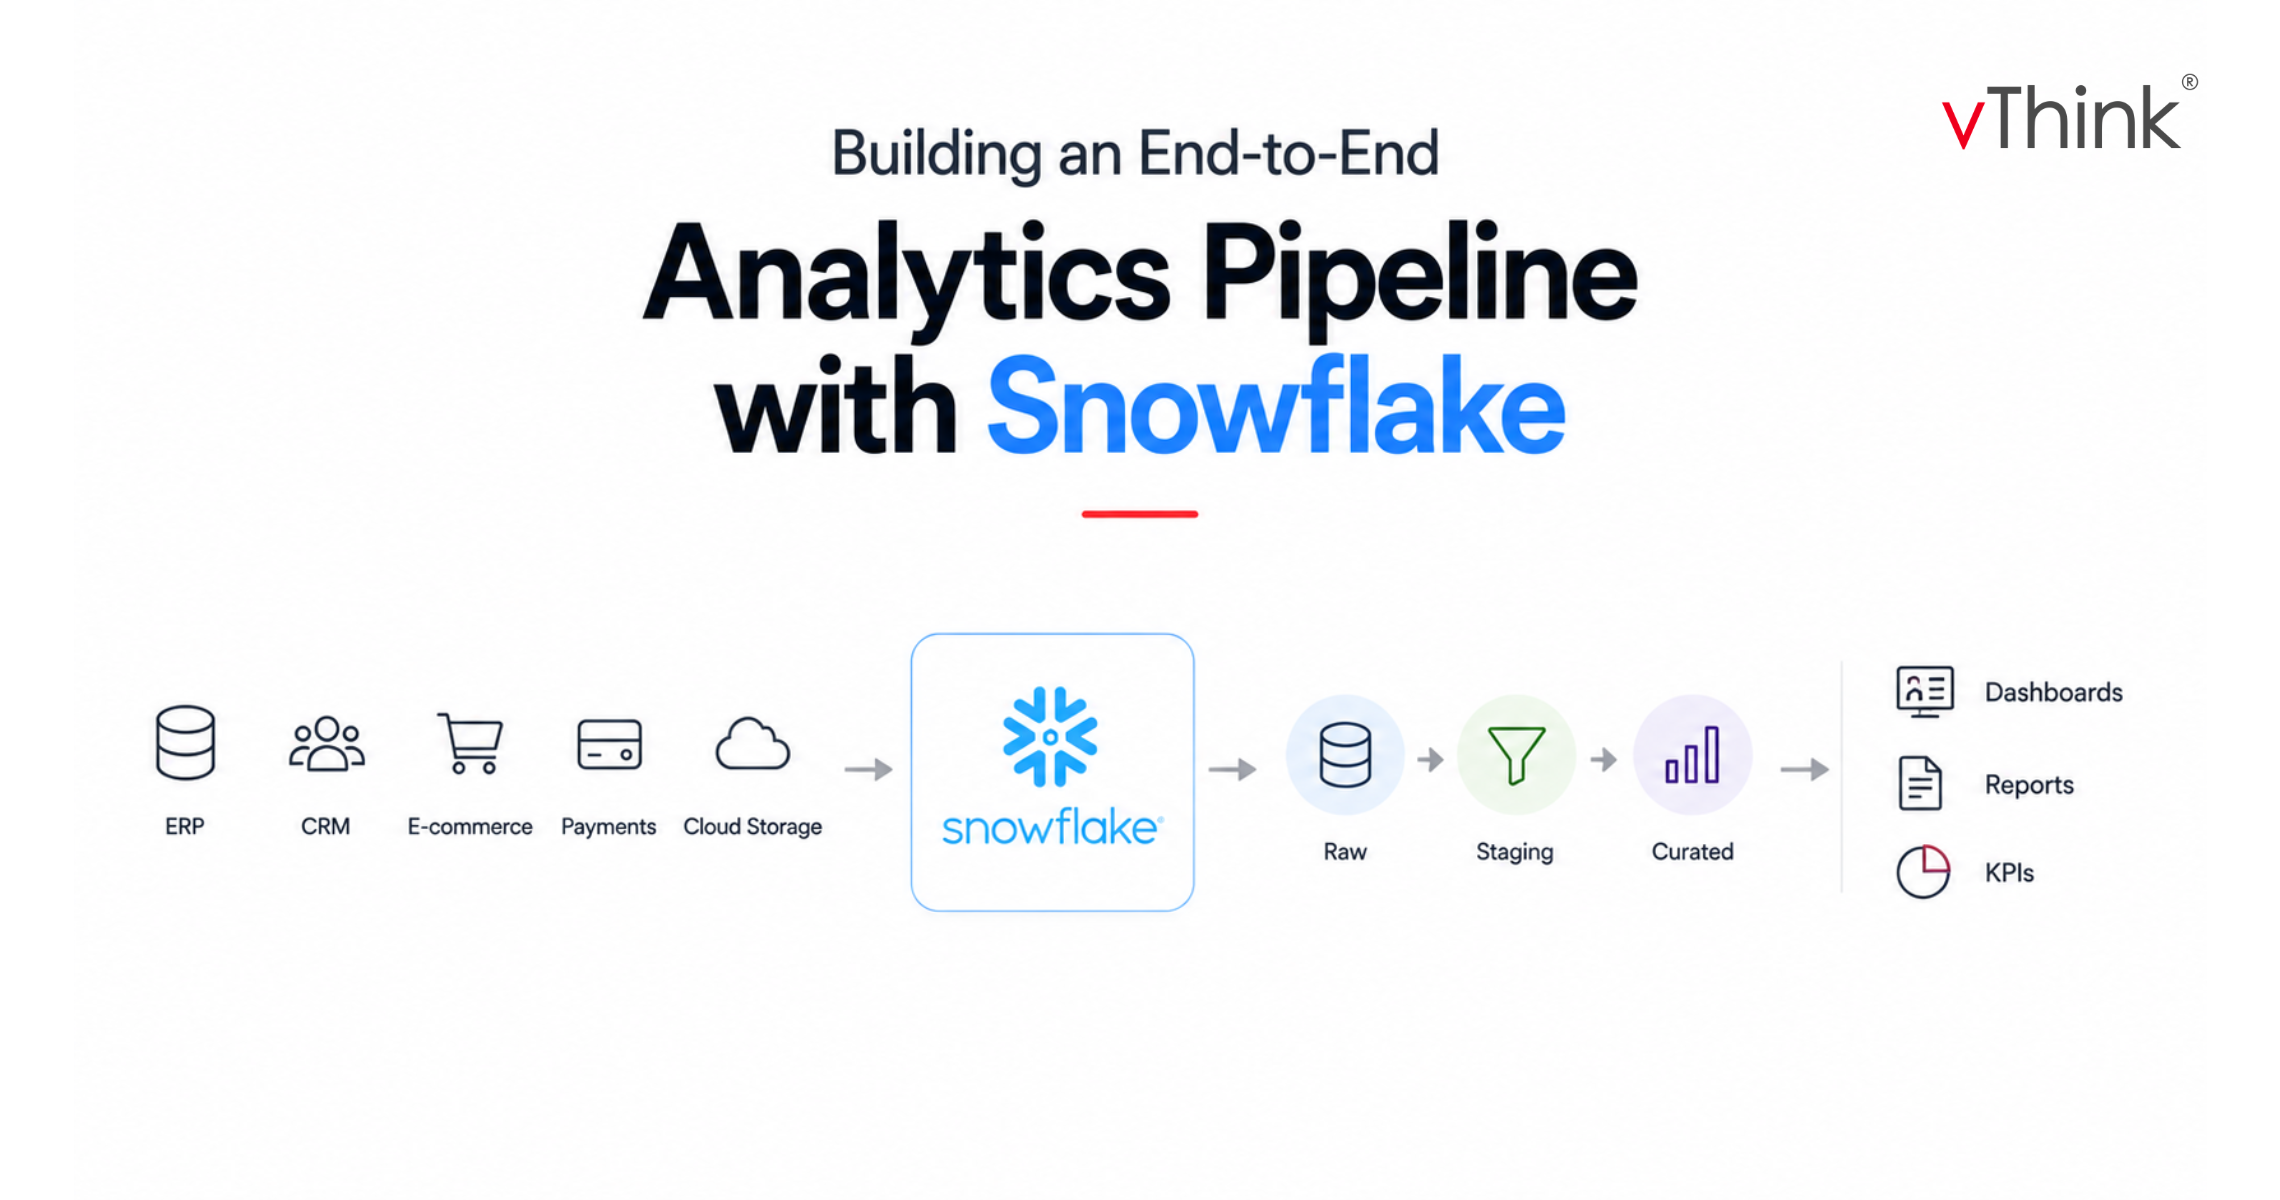
In today’s data-driven business environment, companies rarely struggle to find data. The bigger challenge is making sense of it.
Orders, customer interactions, website events, payments, inventory updates, and CRM records are generated across multiple systems every day. But raw data sitting across spreadsheets, databases, cloud storage, and business applications doesn’t automatically become useful information.
The real value comes when that data is collected, cleaned, connected, transformed, and delivered in a form that people can trust and act on.
This is where Snowflake can play an important role. Its cloud data platform provides capabilities for ingesting, transforming, storing, and analyzing data at scale, while separating storage and compute so teams can scale workloads independently. Snowflake also provides features such as Snowpipe, Streams, Tasks, and Dynamic Tables to support automated data pipelines and fresher analytics.
Why Snowflake?
A modern analytics pipeline needs to handle more than just large volumes of data. It needs to be flexible, reliable, secure, and easy to operate.
✅ Elastic by Design
Snowflake separates storage from compute, allowing teams to scale processing resources independently based on workload requirements.
✅ Connects with Diverse Data Sources
Modern businesses collect data from ERP systems, CRM platforms, e-commerce applications, cloud storage, databases, and streaming sources. Snowflake provides multiple ingestion and integration options to bring these sources together.
✅ Supports Fresh, Automated Data
Snowpipe and Snowpipe Streaming can continuously bring new data into Snowflake, while Streams, Tasks, and Dynamic Tables can help automate downstream processing and transformation.
✅ Less Infrastructure Management
Instead of maintaining traditional database infrastructure, teams can use Snowflake's managed cloud platform and focus more on data engineering and analytics.
✅ Built for Governance and Security
Snowflake provides capabilities such as role-based access control and data protection features that help organizations manage access to sensitive business information.
The result is a platform that helps reduce the gap between “we have the data” and “we can trust the numbers.”
What a Well-Built Analytics Pipeline Makes Possible
A properly designed pipeline can turn raw operational data into insights that different teams can use every day.
🔎 Sales Analysis
Understand which products, regions, stores, or customer segments are driving revenue.
📈 Trend Tracking
Monitor changes in revenue, orders, returns, conversions, or other business metrics over time.
🗺️ Geographic Insights
Analyze sales, delivery performance, customer activity, or churn across regions and locations.
⚖️ Year-over-Year Comparisons
Compare current performance against previous periods to identify growth patterns and areas that need attention.
🎯 Executive KPIs
Give leadership a consistent view of the handful of metrics that matter most.
The important part isn't simply having these dashboards. It is ensuring that the data behind them is consistent, reliable, and refreshed at the required level of freshness.
Know Your Data Before You Build Anything
One of the easiest mistakes in data engineering is starting with the pipeline before understanding the data.
Before writing transformations, take time to understand where the data comes from and what each field actually represents.
✅ Check Data Types
Make sure dates, numbers, timestamps, identifiers, and text fields are interpreted correctly.
✅ Identify Missing and Inconsistent Values
Nulls, duplicates, unexpected formats, and outliers can create problems further down the pipeline.
✅ Understand the Data Grain
Determine what one row represents.
Is it a customer? An order? An order line? A daily sales total?
Getting this wrong can lead to incorrect joins and double-counted metrics.
✅ Understand Relationships
Identify primary keys, foreign keys, and relationships between tables before combining them.
For example, a retail organization might receive data from its ERP, CRM, e-commerce platform, and payment gateway. Understanding how those datasets refresh, what their fields mean, and where quality issues exist makes the rest of the pipeline much easier to design.
A few hours spent profiling source data can save days of troubleshooting later.
From Raw Files to a Living Data Pipeline
Once the source data is understood, the next question is how it should move through the analytics platform.
A typical flow looks something like this:
Source Systems → Cloud Storage / Ingestion → Snowflake → Transformation Layers → Curated Data → BI Dashboards
The exact architecture will vary depending on the organization, data sources, latency requirements, and transformation needs.
But one principle remains important: don't send raw operational data directly to business dashboards.
Instead, introduce layers that progressively improve the quality and usability of the data.
This creates a separation between:
- Data as it arrived
- Data after technical cleanup
- Data after business transformation
- Data ready for reporting
That separation protects business users from source-system inconsistencies and makes the pipeline easier to maintain.
Layering Your Data Like a Pro
Think of the data pipeline like preparing a report.
The first version captures the information as it arrived. The next version cleans and organizes it. The final version contains the information that is ready to share.
A similar approach can be used in Snowflake.
✅ Raw Layer
The raw layer preserves source data with minimal transformation.
Its purpose is to maintain a reliable representation of what was received so that data can be traced back to its source when needed.
✅ Staging Layer
The staging layer prepares the data for downstream processing.
Typical activities include:
- Standardizing column names
- Converting data types
- Handling null values
- Removing or managing duplicates
- Applying basic validation
- Normalizing source-specific formats
✅ Curated / Data Mart Layer
This is where data becomes business-ready.
Tables can be joined, enriched, aggregated, and structured around business concepts such as:
- Sales
- Customers
- Products
- Inventory
- Orders
- Revenue
The goal is to provide clean datasets that BI tools and business users can consume without repeatedly rebuilding the same logic.
This layered approach also makes changes easier to manage. When business logic changes, the transformation can be updated in the appropriate layer instead of being duplicated across multiple dashboards.
Automating the Pipeline with Snowpipe, Streams, Tasks, and Dynamic Tables
Snowflake provides several capabilities for building automated data pipelines. The right combination depends on the architecture and use case.
✅ Snowpipe
Snowpipe can automatically load new files as they become available in supported cloud storage environments, reducing the need for manual loading processes.
For row-level continuous ingestion, Snowpipe Streaming provides another approach for sending data directly into Snowflake with low latency.
✅ Streams
Streams capture changes made to supported Snowflake objects, including inserts, updates, and deletes. This makes them useful for change data capture (CDC) patterns.
✅ Tasks
Tasks can execute SQL or other supported operations on a schedule or based on conditions, allowing teams to automate transformation workflows and chain processing steps.
Snowflake also supports triggered tasks that can execute when changes are detected through streams.
✅ Dynamic Tables
Dynamic Tables provide a more declarative approach to building certain transformation pipelines.
Instead of manually orchestrating every transformation step, you define the result you want using a query and specify a target freshness goal. Snowflake then manages the refresh process.
This is an important distinction: Dynamic Tables don't simply mean “Streams and Tasks, but newer.” They can replace some Streams-and-Tasks patterns where a declarative transformation model fits better, while Streams and Tasks remain useful for workflows that require more explicit control.
Together, these capabilities can significantly reduce manual pipeline management and help organizations keep analytical datasets up to date.
Turning Curated Data into Dashboards People Trust
The curated layer is where the data pipeline meets business intelligence.
Tools such as Power BI and Sigma can consume these trusted datasets and turn them into dashboards, reports, and analytical experiences.
Because the underlying data has already been cleaned, standardized, joined, and modeled, report builders don't need to repeatedly recreate the same transformation logic.
For example, sales, inventory, and executive dashboards can all use the same trusted revenue dataset.
That creates an important benefit:
When two teams look at “total revenue,” they should see the same number.
This consistency is one of the biggest reasons to invest in a well-designed analytics pipeline.
The goal isn't simply to move data from one system to another.
The goal is to create a reliable chain from source data → trusted data → meaningful insight.
A Simple End-to-End View
A modern Snowflake analytics pipeline can be thought of as five major stages:
1. Ingest
Bring data from operational systems and external sources into the platform.
2. Preserve
Maintain raw data so that source information remains traceable.
3. Transform
Clean, standardize, validate, and enrich the data.
4. Curate
Create business-ready datasets designed around reporting and analytical needs.
5. Analyze
Connect BI tools and dashboards to those trusted datasets.
The technology may evolve, but this fundamental flow remains valuable because it creates a clear path from operational data to business decisions.
Conclusion
Building an end-to-end analytics pipeline with Snowflake isn't about using every feature available.
It's about creating a data flow that is reliable, maintainable, scalable, and trusted by the people who depend on it.
Start by understanding your data. Build a clear ingestion strategy. Preserve the raw information. Introduce staging and transformation layers. Use automation where it makes sense. Then deliver clean, curated datasets to the BI tools your teams already use.
When these pieces work together, scattered orders, customer interactions, payments, inventory updates, and digital events can become something far more valuable: a consistent source of insight that helps people make better decisions.
The ultimate measure of a successful analytics pipeline isn't how complicated the architecture looks.
It's how confidently someone can open a dashboard and trust what they see.