


Microsoft Power BI in a Nutshell
Power BI or PBI is a reporting and data visualisation tool and has a collection of software services, apps, and connectors that work together to turn unrelated sources of data into coherent and interactive visual insights.

What is Power BI?
Power BI or PBI is a reporting and data visualisation tool and has a collection of software services, apps, and connectors that work together to turn unrelated sources of data into coherent and interactive visual insights. The data may be of any source like an Excel spreadsheet, or a cloud-based and on-premises hybrid data warehouses. Power BI lets you easily connect to your data sources, visualize, and discover, and share that with everyone you want.
The Parts of Power BI:
Power BI consists of several elements which works together, starting with these three basics:
- A Windows desktop application called Power BI Desktop.
- An online SaaS (Software as a Service) service called the Power BI service.
- Power BI mobile apps for Windows, iOS, and Android devices.
To consume business insights effectively, the three elements - Power BI Desktop, Power BI service, and the Power BI mobile apps-are designed to let you create and share the data.
Apart from the above referred tools, Power BI also features two other elements:
- Power BI Report Builder - Create paginated reports for sharing in the Power BI service.
- Power BI Report Server: A local report server where you can publish Power BI reports created in Power BI Desktop.
What is Power BI Desktop?
Power BI Desktop is a free application that you install on your local computer that enables you to connect, transform, and visualize data. With Power BI Desktop, you can connect to multiple different data sources and combine them into a data model (also known as modeling). With this data model, you can create collections of visuals that can be shared as reports with others in your organization. Most people working on business intelligence projects use Power BI Desktop to create reports and use the Power BI service to share reports with others.
The most common uses for Power BI Desktop are as follows:
- Connect to your data.
- Transform and cleanse data to create a data model.
- Create visualizations such as charts and graphs that visually represent your data.
- Create a report, which is a collection of visuals on one or more report pages.
- Share reports with others using the Power BI service.
There are three views available in Power BI Desktop, which could be selected available on the left side of the canvas. The views, shown in the order they appear, are as follows:
- Report: Create reports and visuals, where most of the creation time is spent.
- Data: View the tables, measures, and other data used in the data model associated with the report and transform the data for best use in the report's model.
- Model: View and manage the relationships among tables in your data model.
Connections in Power BI
- Import mode
- Direct Query
- Live connection
Connection type is not Data Source Type
Connection type does not imply data source type. Apparently Power BI supports over 160 data source types. The connection type is how the connection to the data source is created. A data source can support multiple types of connections. For example, you can connect to a SQL Server database using data import or direct query. This is the same data source, but with a different connection type. Be careful when choosing a connection. Some connections are suitable for small datasets, some support large datasets, and some are flexible. Choosing a connection type is one of the first decisions you should make. Otherwise, it may require a lot of rework.
Connect to Data
To get started with Power BI Desktop, the first step is to connect to data. There are many different data sources from which one can connect to from Power BI Desktop.
To connect to data:
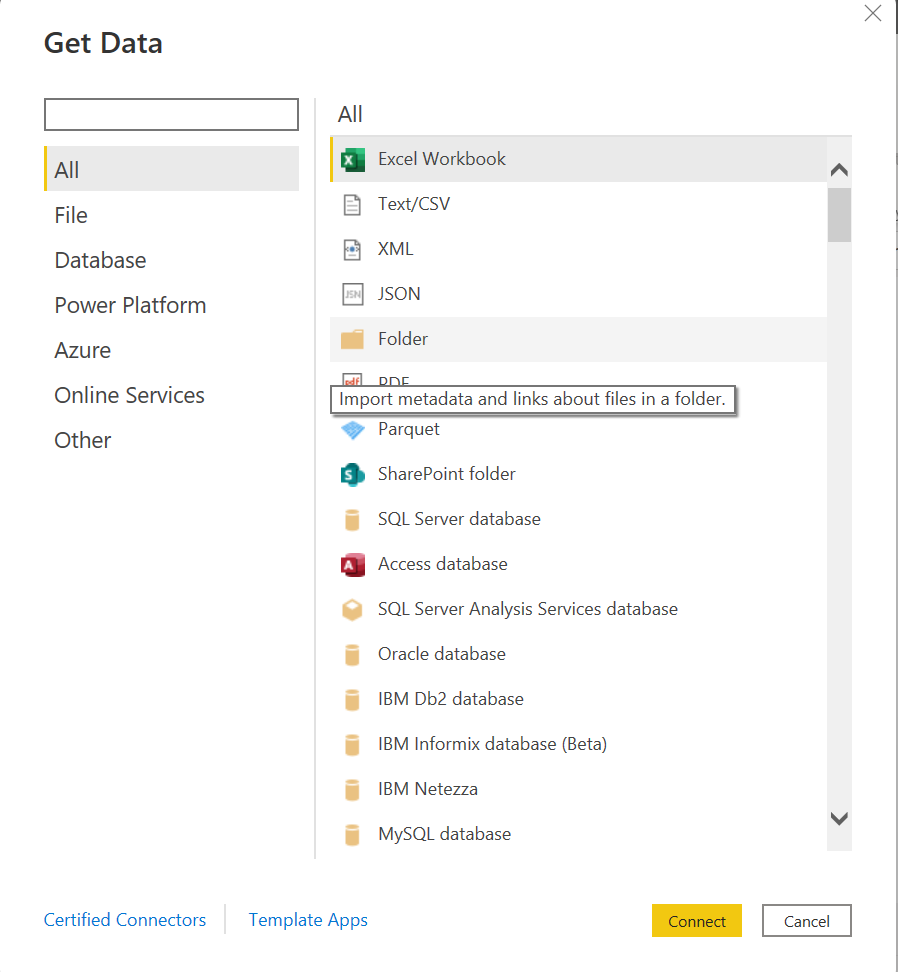
- Go to Home ribbon, select Get Data > More. The Get Data window appears, showing many categories that Power BI Desktop can connect to.
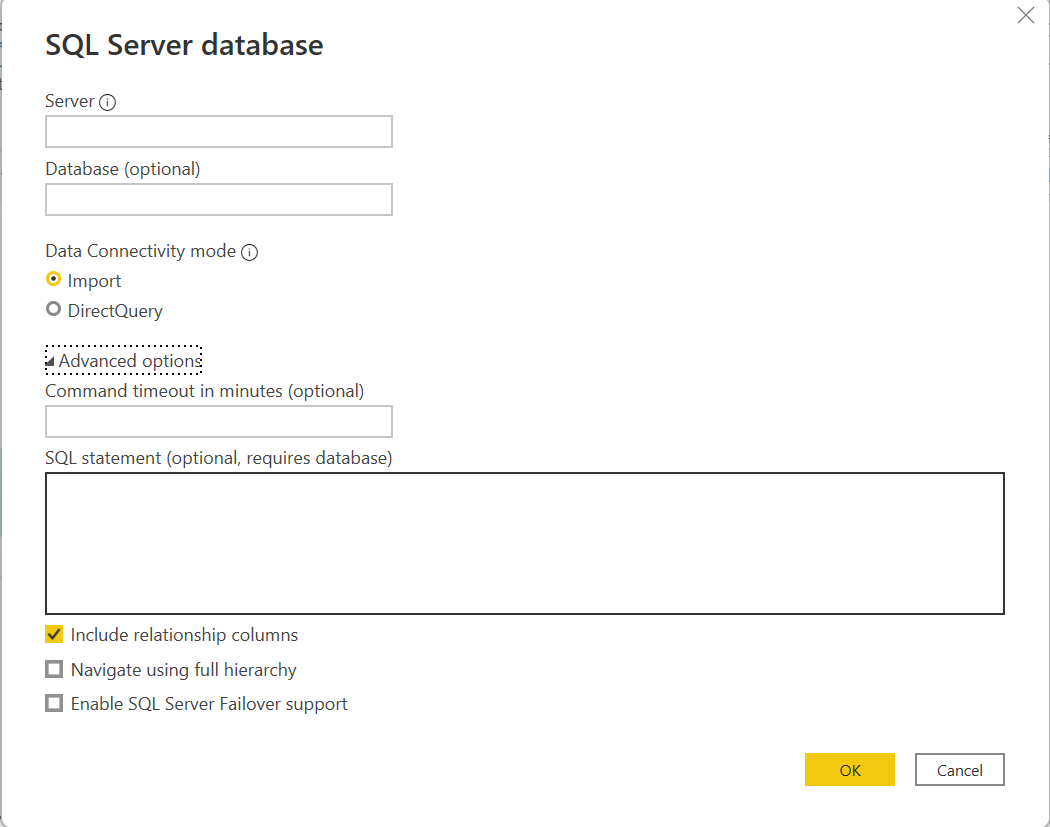
- Once the Data Type is selected, the URL and credentials necessary for Power BI Desktop to connect to the data source needs to be entered.
- After connecting to one or more data sources, the data can be transformed as per the requirement.
Transform and Clean Data, Create a Model
Power BI Desktop helps cleanse and transform the data using the built-in Power Query editor. Power Query Editor can be used to modify the data. For example, changing data types, removing columns, combining data from multiple sources, and so on..
To start Power Query Editor:
- On the Home ribbon, in the Queries section, select Transform data. The Power Query Editor window appears.
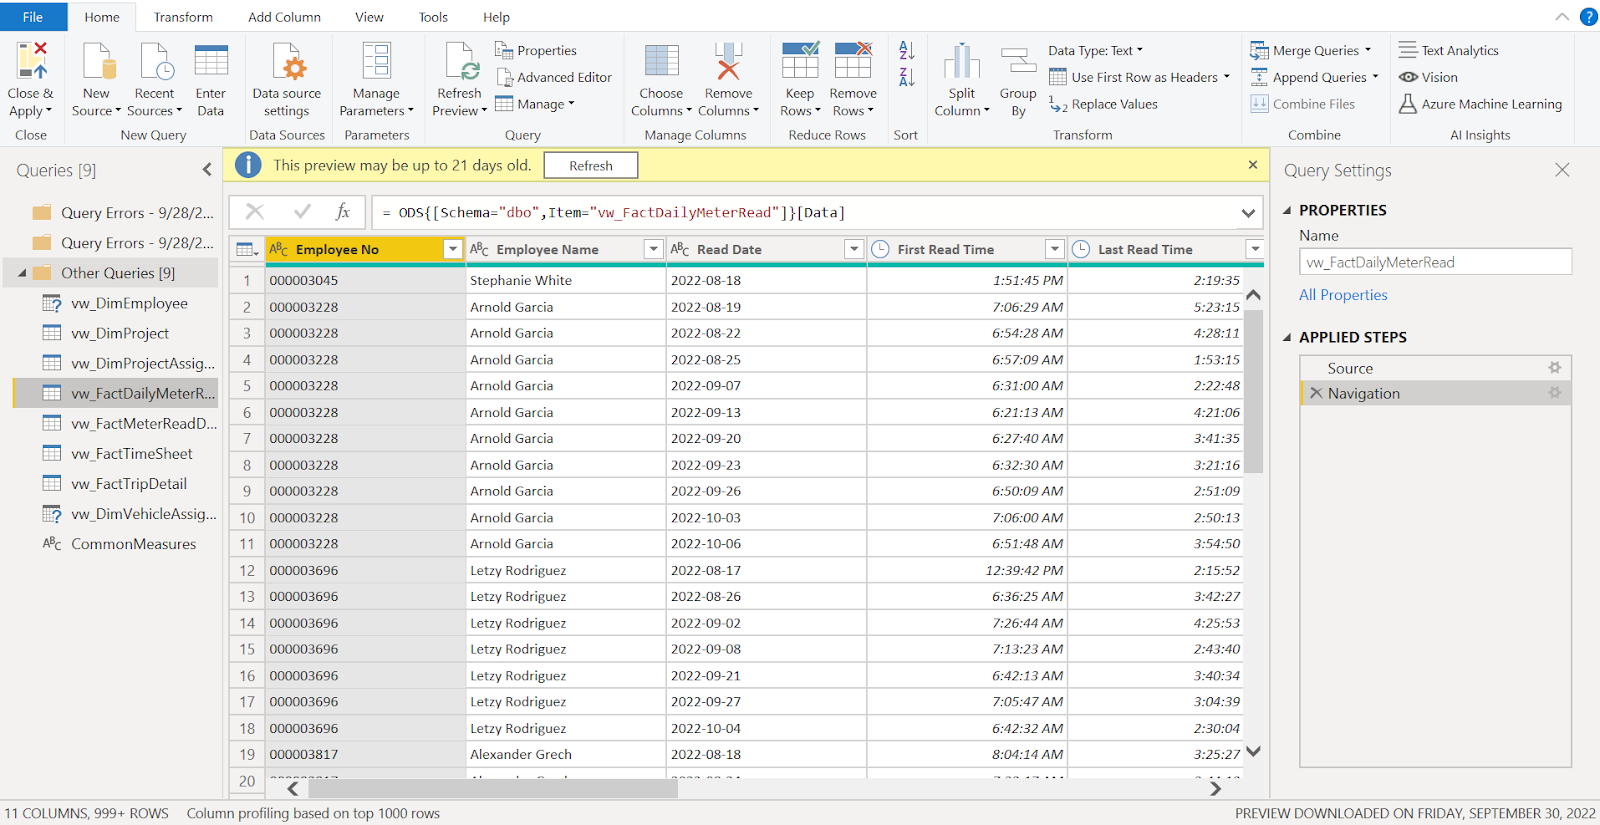
The Power Query Editor records every step that is taken in transforming data (such as renaming a table, transforming a data type, or deleting a column). Every time a query connects to the data source, those steps are carried out so that the data is always tailored as per the need..
Once the data is cleansed, visualizations can be created.
Visualizations
A business generates more data every day about sales revenue, marketing performance, customer interactions, inventory levels, production metrics, staffing levels, costs, and other KPIs. The problem is that people often find it difficult to see the story behind the data with so much to sift through. Data visualization makes all that granular information easily understandable, visually compelling, and relevant. In addition to helping you see your KPIs more clearly, today's data visualization tools also apply AI-driven analytics to reveal relationships between your KPIs, the market, and the world.
Types of visualizations in Power BI
Stacked Bar Chart ,Stacked Column Chart, Clustered Bar Chart, Clustered Column Chart, 100% Stacked Bar Chart, 100% Stacked Column Chart, Line Chart, Area Chart, Stacked Area Chart, Line and Stacked Column Chart, Line and Clustered Column Chart, Ribbon Chart, Waterfall Chart, Funnel Chart, Scatter Chart, Pie Chart, Donut Chart, Tree map, Map, Filled Map, ArcGIS Map, Gauge, Card, Multi-Row Card, Key Performance Indicator (KPI), Slicer, Table, Matrix, R Script Visual, Python Visual, Key Influencers, Decomposition Tree, Q&A, Custom Visuals.
Relationships in Power BI
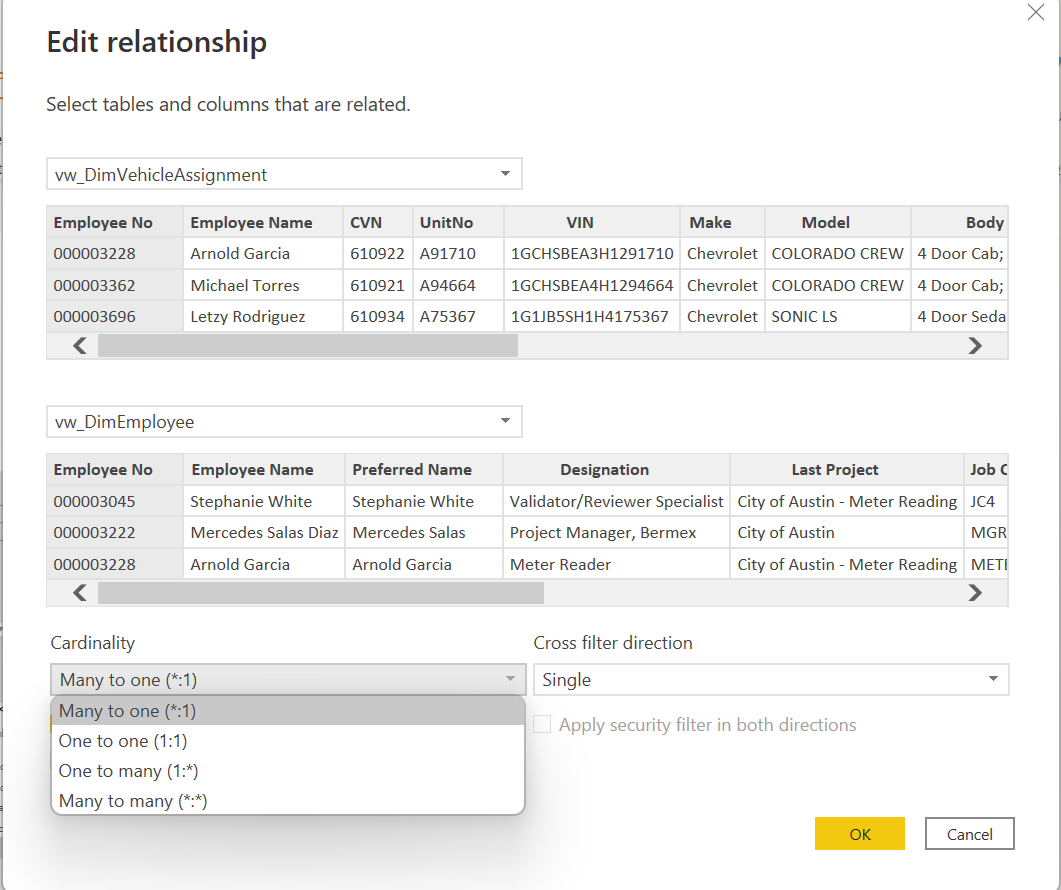
- One-to-many (1: *)
- Many-to-one (*:1)
- One-to-one (1:1)
- Many-to-many (*: *)
Relationship Purpose
A model relationship propagates filters applied on the column of one model table to a different model table. Filters will propagate so long as there's a relationship path to follow, which can involve propagation to multiple tables.
Relationship paths are deterministic, meaning that filters are always propagated in the same way and without random variation. Relationships can, however, be disabled, or have filter context modified by model calculations that use particular DAX functions.
Other major features in PBI are
- DAX formulas and functions
- Dataset Refresh (Scheduled and Incremental)
- RLS (Row Level Security)
Real-time Application Implementation, Problems and Solutions
Created dashboard for restaurant and guest event-based data:
- Multiple dashboards are created in single page with multiple tabs.
- Used filters at 3 levels such as Visual-level, page-level and report-level.
- Multi-level of business analytics based on category, region and period.
- Created calculated columns and used DAX formulas extensively to get results based on measures.
- Applied filters on maps using power queries that customize data to get the required output.
- Used bi-directional relation to connect between data tables to get the required visuals that gives more meaning to analytics and to avoid ambiguity.
- Successfully overcome space issues that exceeded licensed pro version while publishing dataset by applying filter to get limited period of historical data.
- Avoided bi-directional relationships to improve the performance by using workarounds in visuals.
- Restricted direct query as it hinders the performance by continuous update.
- Successfully implemented RLS which restricts data for multiple level of users.
- Re-used dimensions like date dimension in calendar.
Conclusion
Power BI is a technology-driven business intelligence tool provided by Microsoft for analysing and visualizing raw data to present actionable information. It combines business analytics, data visualization, and best practices that helps organisations make decisions that are data-driven.